Easy hard disk health monitoring on Linux with scrutiny and S.M.A.R.T
In my last blog post Clone failing hard disk or partition with ddrescue I explained how to rescue all or parts of data that is stored on a hard disk that is about to die. But of course it’s better to get informed when health values starting to get worse.
You might already have heard of S.M.A.R.T esp. if you have to monitor lots of computers and disks. What is SMART? According to Wikipedia:
S.M.A.R.T. (Self-Monitoring, Analysis and Reporting Technology; often written as SMART) is a monitoring system included in computer hard disk drives (HDDs), solid-state drives (SSDs),[1] and eMMC drives. Its primary function is to detect and report various indicators of drive reliability with the intent of anticipating imminent hardware failures. When S.M.A.R.T. data indicates a possible imminent drive failure, software running on the host system may notify the user so preventive action can be taken to prevent data loss, and the failing drive can be replaced and data integrity maintained.
Personally (and I think that’s true for quite some more people too) SMART values, which you might get via smartctl CLI utility e.g., are hard to interpret and the amount of information is a little bit overwhelming. SMART (or smartd daemon which is the process normally used with Linux) provides over a hundred of values or attributes. smartd (or smartctl CLI utility) doesn’t differentiate between critical and informational values. So it’s not really easy to figure out which values are the important ones. A sample output of smartctl of a Samsung EVO 870 that already had various issues looks like this:
smartctl 7.3 2022-02-28 r5338 [x86_64-linux-5.18.14-arch1-1] (local build)
Copyright (C) 2002-22, Bruce Allen, Christian Franke, www.smartmontools.org

=== START OF INFORMATION SECTION ===
Model Family:     Samsung based SSDs
Device Model:     Samsung SSD 870 EVO 1TB
Serial Number:    S626NJ0R132949M
LU WWN Device Id: 5 002538 f31139440
Firmware Version: SVT01B6Q
User Capacity:    1,000,204,886,016 bytes [1.00 TB]
Sector Size:      512 bytes logical/physical
Rotation Rate:    Solid State Device
Form Factor:      2.5 inches
TRIM Command:     Available, deterministic, zeroed
Device is:        In smartctl database 7.3/5319
ATA Version is:   ACS-4 T13/BSR INCITS 529 revision 5
SATA Version is:  SATA 3.3, 6.0 Gb/s (current: 6.0 Gb/s)
Local Time is:    Sun Jul 31 16:11:23 2022 CEST
SMART support is: Available - device has SMART capability.
SMART support is: Enabled
AAM feature is:   Unavailable
APM feature is:   Unavailable
Rd look-ahead is: Enabled
Write cache is:   Enabled
DSN feature is:   Unavailable
ATA Security is:  Disabled, frozen [SEC2]
Wt Cache Reorder: Enabled

=== START OF READ SMART DATA SECTION ===
SMART overall-health self-assessment test result: PASSED

General SMART Values:
Offline data collection status:  (0x00) Offline data collection activity
                                        was never started.
                                        Auto Offline Data Collection: Disabled.
Self-test execution status:      (   0) The previous self-test routine completed
                                        without error or no self-test has ever
                                        been run.
Total time to complete Offline
data collection:                (    0) seconds.
Offline data collection
capabilities:                    (0x53) SMART execute Offline immediate.
                                        Auto Offline data collection on/off support.
                                        Suspend Offline collection upon new
                                        command.
                                        No Offline surface scan supported.
                                        Self-test supported.
                                        No Conveyance Self-test supported.
                                        Selective Self-test supported.
SMART capabilities:            (0x0003) Saves SMART data before entering
                                        power-saving mode.
                                        Supports SMART auto save timer.
Error logging capability:        (0x01) Error logging supported.
                                        General Purpose Logging supported.
Short self-test routine
recommended polling time:        (   2) minutes.
Extended self-test routine
recommended polling time:        (  85) minutes.
SCT capabilities:              (0x003d) SCT Status supported.
                                        SCT Error Recovery Control supported.
                                        SCT Feature Control supported.
                                        SCT Data Table supported.

SMART Attributes Data Structure revision number: 1
Vendor Specific SMART Attributes with Thresholds:
ID# ATTRIBUTE_NAME          FLAGS    VALUE WORST THRESH FAIL RAW_VALUE
  5 Reallocated_Sector_Ct   PO--CK   094   094   010    -    68
  9 Power_On_Hours          -O--CK   097   097   000    -    12560
 12 Power_Cycle_Count       -O--CK   099   099   000    -    22
177 Wear_Leveling_Count     PO--C-   099   099   000    -    4
179 Used_Rsvd_Blk_Cnt_Tot   PO--C-   094   094   010    -    68
181 Program_Fail_Cnt_Total  -O--CK   100   100   010    -    0
182 Erase_Fail_Count_Total  -O--CK   100   100   010    -    0
183 Runtime_Bad_Block       PO--C-   094   094   010    -    68
187 Uncorrectable_Error_Cnt -O--CK   100   100   000    -    0
190 Airflow_Temperature_Cel -O--CK   069   063   000    -    31
195 ECC_Error_Rate          -O-RC-   200   200   000    -    0
199 CRC_Error_Count         -OSRCK   100   100   000    -    0
235 POR_Recovery_Count      -O--C-   099   099   000    -    14
241 Total_LBAs_Written      -O--CK   099   099   000    -    1419503220
                            ||||||_ K auto-keep
                            |||||__ C event count
                            ||||___ R error rate
                            |||____ S speed/performance
                            ||_____ O updated online
                            |______ P prefailure warning

General Purpose Log Directory Version 1
SMART           Log Directory Version 1 [multi-sector log support]
Address    Access  R/W   Size  Description
0x00       GPL,SL  R/O      1  Log Directory
0x01           SL  R/O      1  Summary SMART error log
0x02           SL  R/O      1  Comprehensive SMART error log
0x03       GPL     R/O      1  Ext. Comprehensive SMART error log
0x04       GPL,SL  R/O      8  Device Statistics log
0x06           SL  R/O      1  SMART self-test log
0x07       GPL     R/O      1  Extended self-test log
0x09           SL  R/W      1  Selective self-test log
0x10       GPL     R/O      1  NCQ Command Error log
0x11       GPL     R/O      1  SATA Phy Event Counters log
0x13       GPL     R/O      1  SATA NCQ Send and Receive log
0x30       GPL,SL  R/O      9  IDENTIFY DEVICE data log
0x80-0x9f  GPL,SL  R/W     16  Host vendor specific log
0xa1           SL  VS      16  Device vendor specific log
0xa5           SL  VS      16  Device vendor specific log
0xce           SL  VS      16  Device vendor specific log
0xe0       GPL,SL  R/W      1  SCT Command/Status
0xe1       GPL,SL  R/W      1  SCT Data Transfer

SMART Extended Comprehensive Error Log Version: 1 (1 sectors)
No Errors Logged

SMART Extended Self-test Log Version: 1 (1 sectors)
No self-tests have been logged.  [To run self-tests, use: smartctl -t]

SMART Selective self-test log data structure revision number 1
 SPAN  MIN_LBA  MAX_LBA  CURRENT_TEST_STATUS
    1        0        0  Not_testing
    2        0        0  Not_testing
    3        0        0  Not_testing
    4        0        0  Not_testing
    5        0        0  Not_testing
  256        0    65535  Read_scanning was never started
Selective self-test flags (0x0):
  After scanning selected spans, do NOT read-scan remainder of disk.
If Selective self-test is pending on power-up, resume after 0 minute delay.

SCT Status Version:                  3
SCT Version (vendor specific):       256 (0x0100)
Device State:                        Active (0)
Current Temperature:                    31 Celsius
Power Cycle Min/Max Temperature:     26/36 Celsius
Lifetime    Min/Max Temperature:     17/40 Celsius
Specified Max Operating Temperature:    70 Celsius
Under/Over Temperature Limit Count:   0/0
SMART Status:                        0xc24f (PASSED)

SCT Temperature History Version:     2
Temperature Sampling Period:         10 minutes
Temperature Logging Interval:        10 minutes
Min/Max recommended Temperature:      0/70 Celsius
Min/Max Temperature Limit:            0/70 Celsius
Temperature History Size (Index):    128 (124)

Index    Estimated Time   Temperature Celsius
 125    2022-07-30 19:00    30  ***********
 ...    ..( 20 skipped).    ..  ***********
  18    2022-07-30 22:30    30  ***********
  19    2022-07-30 22:40    29  **********
 ...    ..( 20 skipped).    ..  **********
  40    2022-07-31 02:10    29  **********
  41    2022-07-31 02:20    30  ***********
  42    2022-07-31 02:30    29  **********
  43    2022-07-31 02:40    29  **********
  44    2022-07-31 02:50    30  ***********
  45    2022-07-31 03:00    30  ***********
  46    2022-07-31 03:10    30  ***********
  47    2022-07-31 03:20    29  **********
  48    2022-07-31 03:30    30  ***********
  49    2022-07-31 03:40    29  **********
  50    2022-07-31 03:50    29  **********
  51    2022-07-31 04:00    30  ***********
  52    2022-07-31 04:10    29  **********
 ...    ..( 45 skipped).    ..  **********
  98    2022-07-31 11:50    29  **********
  99    2022-07-31 12:00    30  ***********
 ...    ..( 21 skipped).    ..  ***********
 121    2022-07-31 15:40    30  ***********
 122    2022-07-31 15:50    31  ************
 123    2022-07-31 16:00    31  ************
 124    2022-07-31 16:10    31  ************

SCT Error Recovery Control:
           Read: Disabled
          Write: Disabled

Device Statistics (GP Log 0x04)
Page  Offset Size        Value Flags Description
0x01  =====  =               =  ===  == General Statistics (rev 1) ==
0x01  0x008  4              22  ---  Lifetime Power-On Resets
0x01  0x010  4           12560  ---  Power-on Hours
0x01  0x018  6      1419503220  ---  Logical Sectors Written
0x01  0x020  6        61693088  ---  Number of Write Commands
0x01  0x028  6      4891690001  ---  Logical Sectors Read
0x01  0x030  6        65882849  ---  Number of Read Commands
0x01  0x038  6          112000  ---  Date and Time TimeStamp
0x04  =====  =               =  ===  == General Errors Statistics (rev 1) ==
0x04  0x008  4               0  ---  Number of Reported Uncorrectable Errors
0x04  0x010  4               0  ---  Resets Between Cmd Acceptance and Completion
0x05  =====  =               =  ===  == Temperature Statistics (rev 1) ==
0x05  0x008  1              31  ---  Current Temperature
0x05  0x020  1              40  ---  Highest Temperature
0x05  0x028  1              17  ---  Lowest Temperature
0x05  0x058  1              70  ---  Specified Maximum Operating Temperature
0x06  =====  =               =  ===  == Transport Statistics (rev 1) ==
0x06  0x008  4             456  ---  Number of Hardware Resets
0x06  0x010  4               0  ---  Number of ASR Events
0x06  0x018  4               0  ---  Number of Interface CRC Errors
0x07  =====  =               =  ===  == Solid State Device Statistics (rev 1) ==
0x07  0x008  1               0  N--  Percentage Used Endurance Indicator
                                |||_ C monitored condition met
                                ||__ D supports DSN
                                |___ N normalized value

Pending Defects log (GP Log 0x0c) not supported

SATA Phy Event Counters (GP Log 0x11)
ID      Size     Value  Description
0x0001  2            0  Command failed due to ICRC error
0x0002  2            0  R_ERR response for data FIS
0x0003  2            0  R_ERR response for device-to-host data FIS
0x0004  2            0  R_ERR response for host-to-device data FIS
0x0005  2            0  R_ERR response for non-data FIS
0x0006  2            0  R_ERR response for device-to-host non-data FIS
0x0007  2            0  R_ERR response for host-to-device non-data FIS
0x0008  2            0  Device-to-host non-data FIS retries
0x0009  2        65535+ Transition from drive PhyRdy to drive PhyNRdy
0x000a  2           18  Device-to-host register FISes sent due to a COMRESET
0x000b  2            0  CRC errors within host-to-device FIS
0x000d  2            0  Non-CRC errors within host-to-device FIS
0x000f  2            0  R_ERR response for host-to-device data FIS, CRC
0x0010  2            0  R_ERR response for host-to-device data FIS, non-CRC
0x0012  2            0  R_ERR response for host-to-device non-data FIS, CRC
0x0013  2            0  R_ERR response for host-to-device non-data FIS, non-CRC
Pretty hard to understand what all that numbers mean IMHO 😉 A little bit better if it comes to usability is GSmartControl. It’s a graphical UI for smartctl and it looks like this:
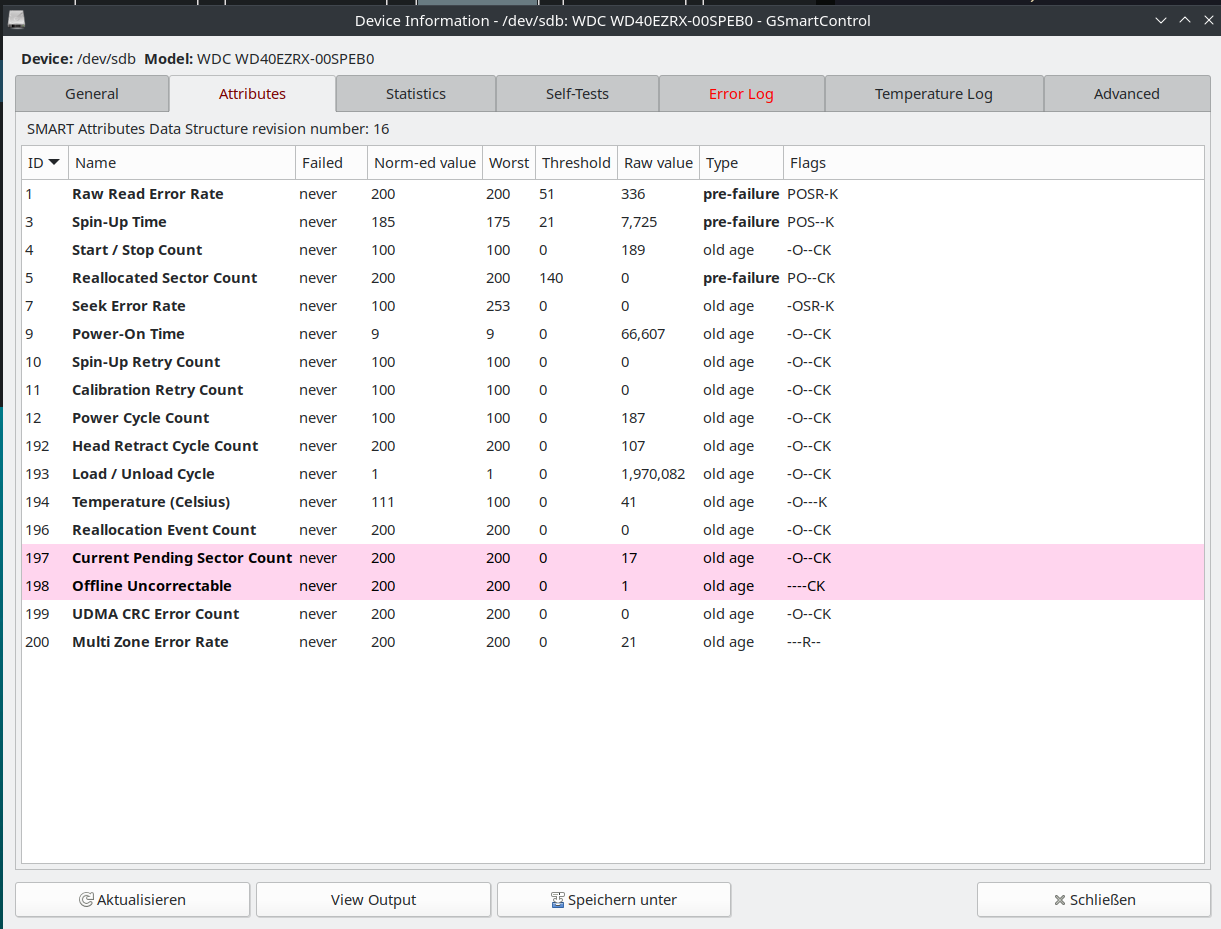
Here you already see that two values are marked red and that this disk is most probably already in a bad state. GSmartControl also provides error logs and quite a few other useful information. But it’s still a lot of data.
This brings me to scrutiny which is a WebUI for smartd. This nice utility focus on the critical SMART metrics and is also able to track metrics for historical trends. And it allows you sending notification via email, Webhooks, Discord, IFTTT, Mattermost, Slack, Teams, Telegram, and so on in case of SMART device failure.
The dashboard of scrutiny looks like this:
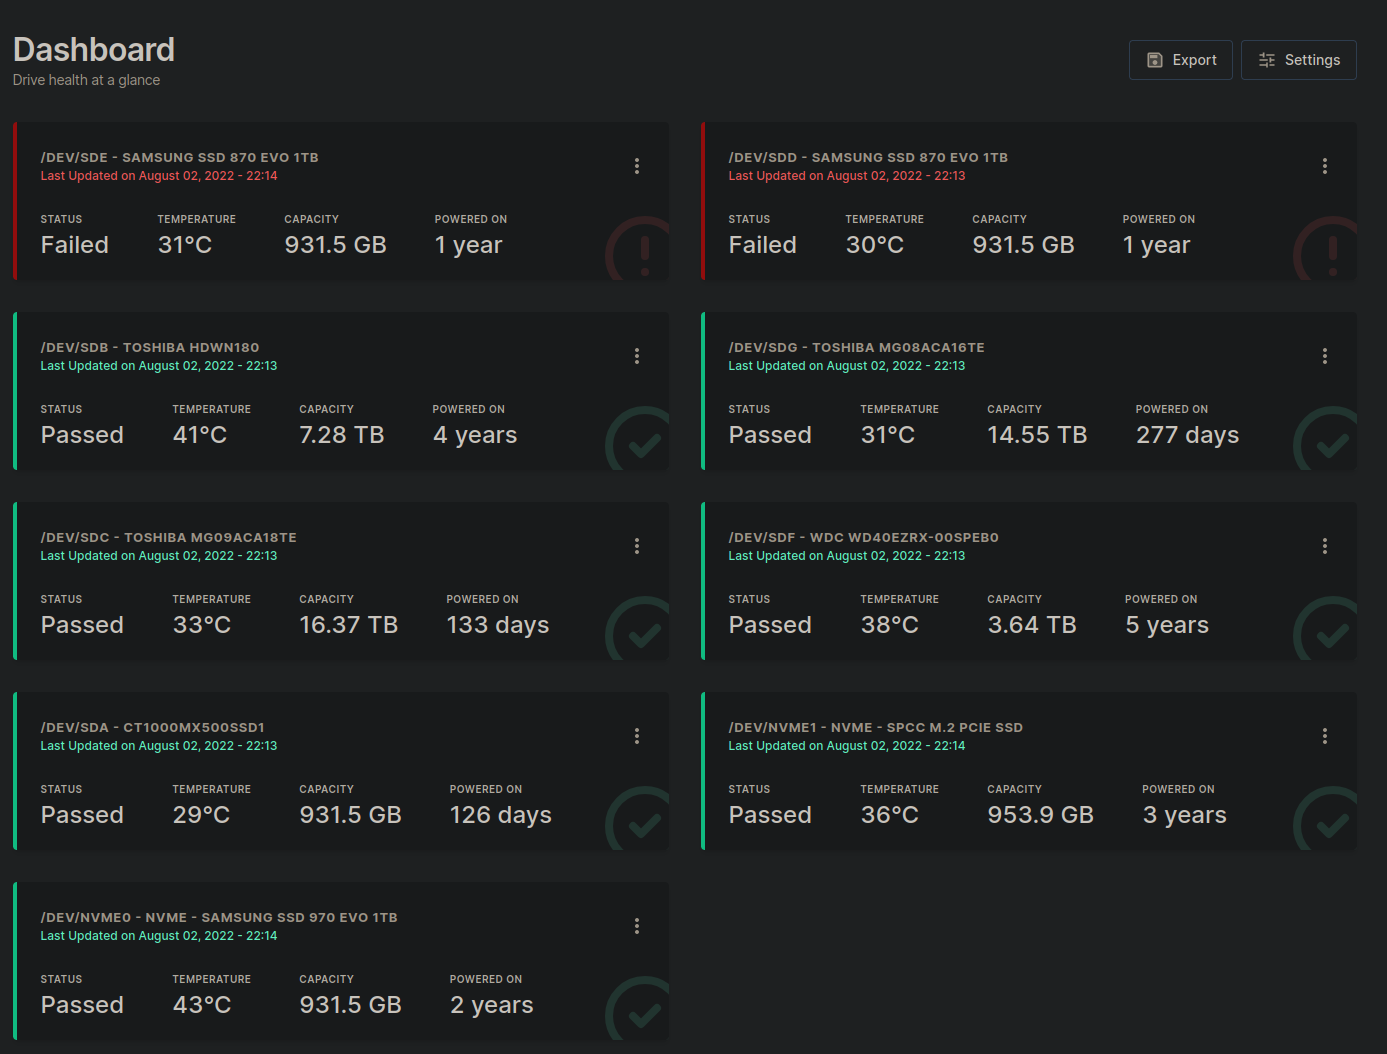
Here it’s already obvious in the overview that two disks having a problem. Clicking on the first problematic disk shows this screen:
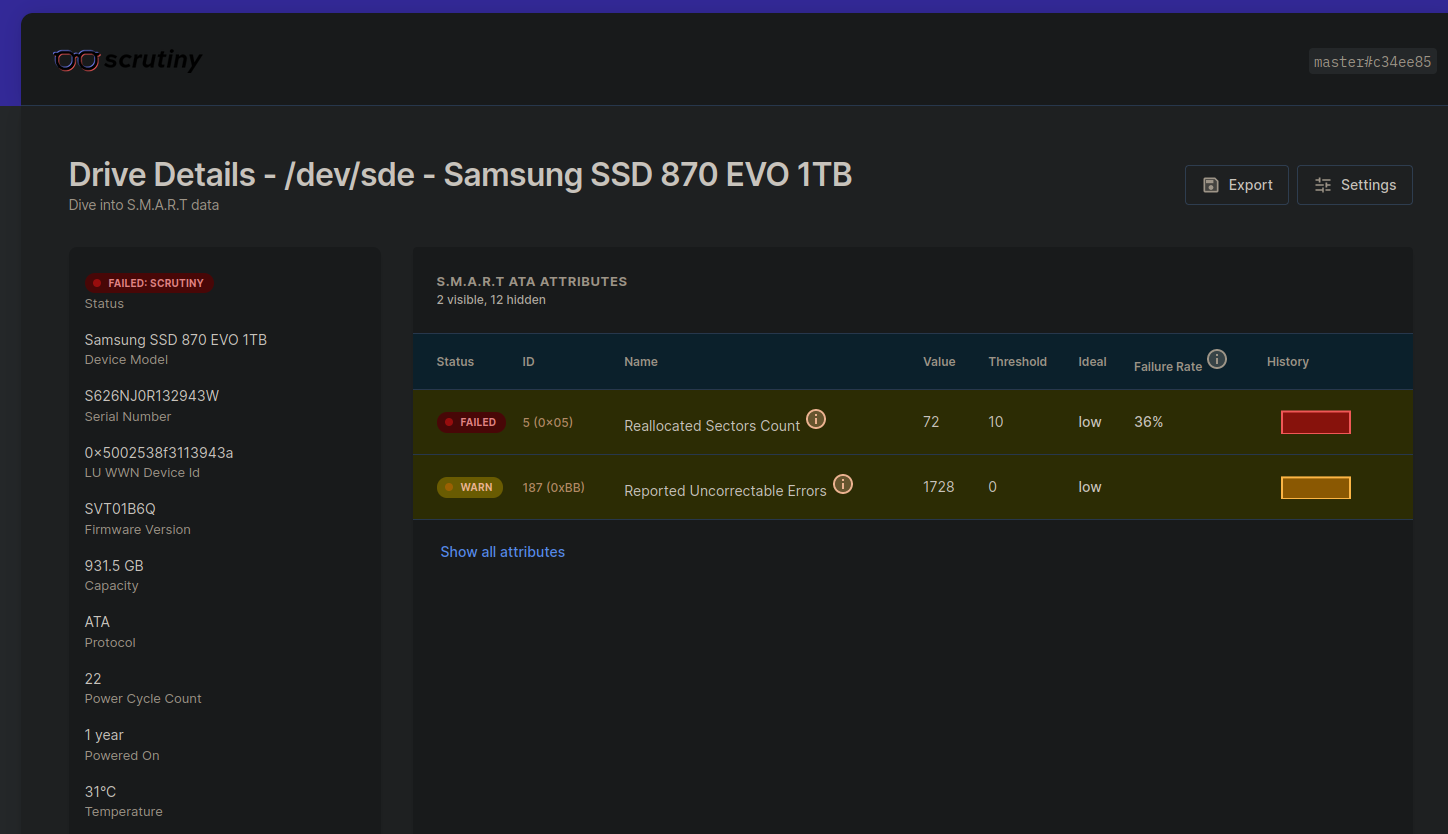
Here only the important values are shown and Reallocated Sectors Count is already at 72 while the Threshold is 10. In case of the two problematic Samsung 870 EVO SSD disks you saw in the overview I opened a Samsung support ticket and got new disks after a week. That was pretty fast and the whole replacement process was pretty smooth after all. But before I returned the disks for replacement I created a clone to rescue the data on this disks similar to the process I describe in Clone failing hard disk or partition with ddrescue.
So back to scrutiny. How to install that utility? Currently the easiest way is to use the Docker omnibus image. The omnibus image contains both the webapp server (frontend & api) as well as the SMART metric collector. If you want to keep historical data among other data provide a directory where scrutiny can store it’s state and data on a host device (normally you loose all data as soon as you stop the Docker container). So lets define a variable with the path to the host directory e.g.:
export SCRUTINY_HOME="${HOME}/.scrutiny"With this variable in place scrutiny will later create a .scrutiny folder in your ${HOME} folder. Now scrutiny container can be started. Here is an example docker command with a list of various options:
docker run
  --interactive \
  --tty \
  --rm \
  --publish 8080:8080 \
  --publish 8086:8086 \
  --volume "${SCRUTINY_HOME}/config:/opt/scrutiny/config" \
  --volume "${SCRUTINY_HOME}/influxdb2:/opt/scrutiny/influxdb" \
  --volume /run/udev:/run/udev:ro \
  --cap-add SYS_RAWIO \
  --cap-add SYS_ADMIN \
  --device=/dev/sda \
  --device=/dev/sdb \
  --device=/dev/sdc \
  --device=/dev/sdd \
  --device=/dev/sde \
  --device=/dev/sdf \
  --device=/dev/sdg \
  --device=/dev/nvme0 \
  --device=/dev/nvme1 \
  --name scrutiny \
  ghcr.io/analogj/scrutiny:master-omnibus
Here are a little explanation about the parameters used above:
--interactivekeeps STDIN open and--ttyallocates a pseudo-TTY. This way you’ll see all log messages printed in you current shell. PressingCTRL+cin this terminal will stop the container.--rmremoves the container when it exits--publish 8080:8080makes thescrutinyWeb UI accessible outside the container (e.g. to the host). So you can open a browser and openhttp://localhost:8080to get thescrutinydashboard.--publish 8086:8086makes InfluxDB API accessible outside the container.--volume "${SCRUTINY_HOME}/config:/opt/scrutiny/config"and--volume "${SCRUTINY_HOME}/influxdb2:/opt/scrutiny/influxdb"maps${SCRUTINY_HOME}/configand{SCRUTINY_HOME}/influxdb2host file/directory into the container. As already mentioned above this allows to store historical data and state in a path on your host disk. Otherwise you’d loose that data as soon as you stop the container.scrutinyallows you to specify aconfigfile. It’s not needed but allows you to configure various additional options like sending notifications.-volume /run/udev:/run/udev:romaps/run/udevdirectory into the container. It’s necessary to provide the Scrutiny collector with access to your device metadata.--cap-add SYS_RAWIOis necessary to allow smartctl to query your device SMART data--cap-add SYS_ADMINis only necessary if you have NVMe devices- All those
--device ...options adds host devices to the container. In my case I mapped all disk devices into the container. Magnetic (HDD) and SSD disks are normally available at/dev/sdXwhileXis the device character.NVMeSSDs are normally available at/dev/nvmeXwhileXis the device number in this case. --name scrutinyis the container nameghcr.io/analogj/scrutiny:master-omnibusis the container image that gets downloaded if not already available on your disk. As already mentioned this image contains all services needed in one image. But it’s also possible to have InfluxDB, Web UI and collector in separate containers. For more information see Hub/Spoke Deployment.
That’s basically it 😉 To make the utility more useful add a configuration file and configure notifications. Also instead of using --interactive and --tty run the container in the background with --detach.